
Abstract
The paper will explore whether Scrum is suitable to be extended to non-IT small business projects in the United States. The researchers conducted a longitudinal action research with 24-month follow-up on 142 small businesses in manufacturing, retail, professional service and healthcare sectors. The results indicated that the custom Scrum had a great positive impact on the project completion rate, the satisfaction of clients, and the productivity of a team. The main modifications were the reduction of the time spent at meetings, the integration of the responsibilities of the Product Owner and Scrum Master, and documentation simplification. Study discovered that the long-term adoption was possible when the management had a commitment at the outset and where teams would continuously perfect the framework as the implementation progressed.Overall,the study can indicate that Scrum could be effective in much more than software development provided that it is adjusted to a non-IT small project environment.
Keywords
Scrum Framework, Agile Project Management, Small Business, Action Research, Organizational Adaptation, Non-it Projects, Longitudinal Study, Business Process Improvement
Introduction
The propagation of agile methods has brought a paradigm shift in the practice of project management in all industries throughout the globe, and the Scrum framework has become the primary scheme of the work organization of complex and knowledge-intensive work (Rigby et al., 2016). The empirical process control theory, that presupposes transparency, inspection, and flexibility, invented by Scrum, initially designed to be applied to software development has been shown to impressively work in volatility, uncertainty, complexity, and ambiguity (VUCA) situations (Schwaber and Sutherland, 2020). However, the prescriptive ceremonies and prescribed roles, as well as artifact requirements of the framework, bring significant problems of implementation to the organizations that are not necessarily a part of the traditional information technology, particularly, the small organizations with scarce resources and horizontal hierarchies (Stettina and Hoez, 2015).
The United States is based on small businesses, of which 99.9 percent of the total corporations, provide employment to 46.8 percent of all labor force, and generate 43.5 percent of gross domestic product (SBA, 2023). Small businesses are highly significant in the economy, however, the management of the projects is mostly informal, and the coordination is informal and discourages scalability and predictability (Turner et al., 2012). The absence of formal strategies causes the high project failure rate as it is estimated that 50 small business projects in the next few years will exceed the budget/timeline, and 20 of them will not yield the desired results at all (Standish Group, 2020). These statistics outline the fact that the creative and lightweight project management structure is highly desired in order to address the specifics of the operation of small businesses but provide sufficient organization to ensure project success.
The application of Scrum into non-IT projects has serious boundary conditions to its conceptual transfer. Traditional Scrum assumes cross-functional teams that are committed to a single task, physical or online workspace and organizational cultures that is open to experimentation by way of iteration (Moe et al., 2012). Small business, however, possesses employees with functional overlaps, ineffective technology, and cultures of management that are based on direct control of emergent self-organization (Bijlsma-Frankema et al., 2020). Such structural dissonances cannot be accommodated wholesale but rather have to adapt in a systematic framework but empirical recommendations on the strategies that would prove effective at altering the circumstances have not yet been systematized but continue to gain theoretical ground (Dingsoyr et al., 2019). The accelerated rate of automation, artificial intelligence(AI), and Internet of Things(IoT) technologies development is altering the data center image of electrical safety and reliability.
The latter scholarly opinion relies on the examination of the adaptation of agile methodology to a vast range of organizational cultures. Conforto et al. (2014) examined scaling agile practices in large organizations, which were not IT-intensive, and results indicated that such critical drivers as executive sponsorship and the creation of iterative capability played a role. Similarly, Stettina and Hörz (2015) analyzed the implementation of Scrum non-software environments, in which the role definition and sustaining the ceremonies were found to be significant problems. However, these studies were conducted mostly on large firms who had significant implementation resources and a broad distance into the relevance of the small business. Furthermore, the literature on the topic is also cross-sectional and captures the snapshots rather than the pathways of sustainability and evolutionary adaptation, which limits the understanding of sustainability and evolutionary adjustment (Dingsoey et al., 2018).
The theoretical basis of Scrum adaptation uses the contingency theory of states that the effectiveness of an organization is centered on the suitability of the structural features in relation to the environmental requirements (Donaldson, 2001). It can be generalized to the project management with the suggestion that the adherence to prescriptive frameworks can result in the inefficiencies of the situation when the situation complexes do not manifest on the presumed conditions. Meanwhile, institutional theory unfolds the selective adaptation and adoption of the management practices by the organization as a way of remaining legitimate besides adapting to the local constraints (Kennedy and Fiss, 2009). These theoretical approaches justify the present research in the fact that the successful implementation of Scrum in small non-IT firms requires success and deliberate change, rather than dogmatism.
It is in this light that the present research will strive to meet the following research objective: to plan, execute and evaluate a personalized Scrum model to non-IT small projects through longitudinal action research when empirically grounded directions of practice and theory will be developed. The central premise is that planned modified Scrum models will offer superior project outcomes compared to non randomly managed frameworks and that the approach of adaptation will sieve the relationship between the faithfulness of execution and the project execution. The continuous observation of organizations throughout the 24 months period allows the research to not only trace the short-term effects of implementation but also trace the sustainability in the long-term, paths of refinement and conditions of the context.
Materials and Methods
Study Design and Theoretical Framework
The longitudinal action research design that this research study used incorporates both scientific inquiry and practical intervention in production of both practice-based knowledge and theory (Baskerville, 1999). Action research is particularly suitable in complex organizational phenomena when the researcher-practitioner relationship permits the researcher to acquire in depth contextual understanding and maintain scientific integrity (Avison et al., 2001). The action research cycle that was used to conduct the research was the canonical action research cycle: diagnosing, action planning, action taking, evaluating and specifying learning (Susman and Evered, 1978) and was refined in 5 cycles, 4.8 months in a period of 24 months.
The institutional theory, coupled with the contingency theory and integrated with agile scholarship, was used in the theoretical framework. The rationality of explanations about the contingency theory-based framework adaptation based on the size of the organization, industry, and available resources was used to explain the concerns of legitimacy and mimetic pressures, which informed the decisions to apply the institutional theory (Kennedy and Fiss, 2009). This two-fold theoretical assumption implied that the adaptations were grounded, and not placed in a random manner.
Participant Recruitment and Sample Characteristics
The respondents were selected and the stratified random sampling of the U.S. Small Business Administration database was used in order to meet the following criteria: (1) less than 50 full-time equivalent employees, (2) not in the IT primary industry classification, (3) longer than two years in operation, and (4) active project-based work (at least three ongoing projects). The stratification gave representation in manufacturing (25%), retail trade (25%), professional services (30%), and in the area of healthcare/social assistance (20%), which reflects the population of small businesses (SBA, 2023).
There were 203 interested organizations as a result of the pre-recruitment process, where 142 were eligible and provided informed consent. The exclusion criteria was applied to narrow down to firms that had already adopted Scrum (n= 31), those with less than five employees (n= 18), and those whose projects were not well documented to make use of them to carry out the assessment (n= 12). The final sample (N = 142) was mixed with respect to the geographic areas: Northeast (28%), Midwest (24%), South (31%), and West (17%). The mean age within organization was 8.4 years (SD = 4.2), and the mean annual revenue was 2.3million (SD =1.8million). The study period showed that the total number of active projects that the participating organizations identified was 847 with an average of 12.3 weeks (SD =8.7).
Intervention Protocol: Tailored Scrum Framework
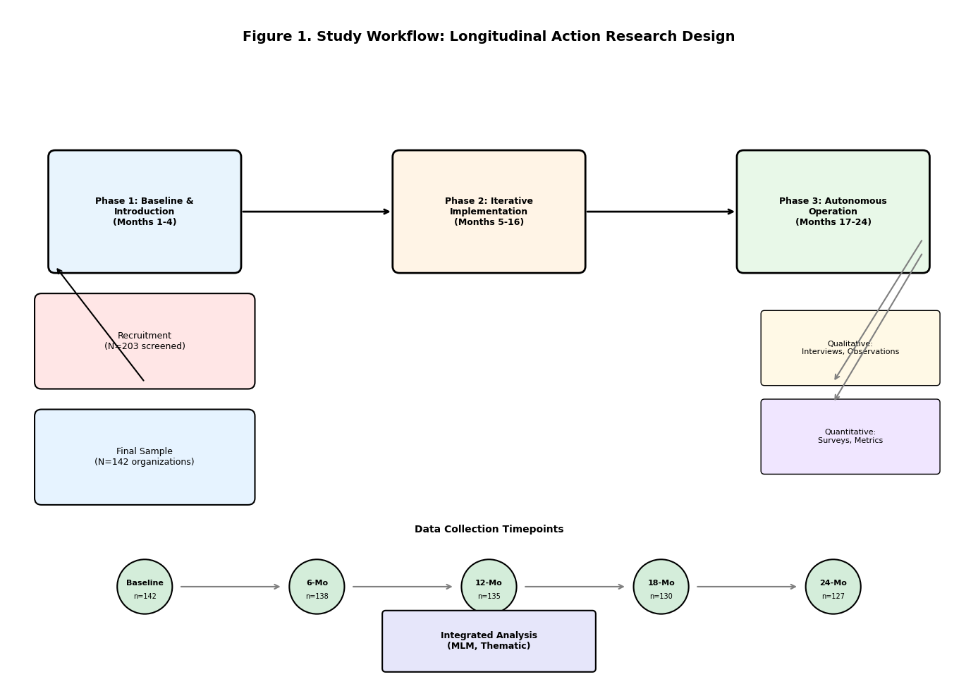
The intervention contained an effective but accommodative Scrum model that adapted to the needs of small businesses. There were three domains in tailoring which included ceremony compression, role hybridization and artifact simplification. Ceremony Compression was concerned with the time-related problems, reducing the time of Sprint 2-4 week to 1 week, Sprint Daily Stand-ups to 10 minutes, and Sprint Planning and Review to 90-minute time. The retrospectives were held at 60 minutes but with frequency of bi-weekly as compared to Sprint. Role Hybridization was conscious of the fact that at the small business level, there were no particular personnel to manage certain Scrum roles. The Product owner and Scrum master were combined in a position of Project Lead which is the usual position of the business owner or senior manager. The Development Team members had maintained the traditional roles and played the roles of the Scrum Team in the implementation of the project. The requirements of documentation were simplified using Artifact Simplification. Product Backlog was maintained in a shared digital spreadsheet, rather than any special software and Sprint Backlogs used simple task boards (either physical or digital) and had uniformed Definition of Done criteria across project in each organization to reduce cognitive load. It would be rolled out in phases: Phase 1 (Months 1-4) baseline assessment and the framework implementation would begin; Phase 2 (Months 5-16) independent operation with monthly coaching under review would stabilize the sustainability; Phase 3 (Months 17-24) assessment would occur at its own pace.
Data Collection Instruments
Quantitative data collected at the baseline, 6-month, 12-month, and 18-month and 24-month intervals were collected using the validated instruments. Project Success Criteria Inventory (PSCI) were used to evaluate the project performance based on the compliance of the scope, compliance of the timeline, budget variance, and satisfaction of the stakeholders ( 0.91) ( Shenhar et al., 2001). The effectiveness of the team that was discussed with the Team Efficacy Scale (TES) that explains the beliefs concerning the collective capability ( 0.88) (Gibson, 2003). The Scrum Implementation Checklist (SIC) that was scaled to a small business was used to determine the Agile adoption fidelity (a = 0.85).
Qualitative data included semi-structured interviews (n = 284, two persons into an organization), participant observation of the 426 Scrum ceremonies, and the documentary analysis of the project artifacts. Interpretations of interview interview protocols were suggested with references to the experiences of implementation, decisions on adaptation, and perceptions. The practice of rituals, group dynamics, and new behaviors were the aspects that were related to observations. The qualitative data that was audio-taped was transcribed and processed within NVivo 14 (word-to-word).
Statistical Analysis
In analyzing the quantitative data, multilevel modeling (MLM) was applied to describe the nested data structures (projects in organizations at time points). The stated main model offered the project results in time-dependent relation of implementation fidelity and strength of adaptation, and chance intercepts of the organization. The repeated-measures ANOVA was employed to test within-subjects change in response to changes in measurement occasions. Mean comparisons and eta 2 (eta 2 ) partial ANOVA used Cohen d effect sizes. All the analyses were carried out in R version 4.3.1 (R Core Team, 2023) with lme4, lmerTest and emmeans packages.
Thematic analysis was applied in qualitative analysis, where Braun and Clarke (2006) identified six stages of this approach familiarization, initial coding, theme searching, theme reviewing, theme defining, and report production. Two researchers who were independent coded 20 percent transcript with a good inter-rater reliability ( 0.81). Disagreements that existed were settled by settling through consensus. They were determined based on the information power framework and perceived the degree of sample size to be sufficient based on the limited scope of the study, the specificity of the study sample, and the high quality of dialogue (Malterud et al., 2016).
Validation and Rigor
Methodological rigor was achieved by a number of methods. Triangulation of quantitative and qualitative data sources was the source of convergent validity. Member checking was also conducted through discussing with 15 randomly selected members some of the initial finding to get their accuracy checking. Audit trails kept all the analytical decisions. The research team maintained reflexivity journals; they utilized them to trace the potential biases and influences of interpretation.
Ethical Considerations
The study protocol received Institutional Review Board approval (Protocol #2021-0847). All participants provided written informed consent. Data were de-identified using alphanumeric codes, with identifying information stored separately in encrypted files. Organizations were compensated with $500 stipends for participation, with no contingent incentives tied to performance outcomes to avoid coercion.
Results:
Implementation Trajectory and Adaptation Patterns
Figure 1 illustrates all the phases of the study, which introduce the participants in the study beginning with recruitment and up to 24 months after the study is carried out. Out of the 142 organizations that had enrolled, 127 (89.4) of them completed the full intervention period, 15 (n=7) left the business, was acquired (n=4) or could not go through with the intervention (n=4). Attrition analysis revealed no differences in the baseline measurement of performance (t (140) = 0.84, p = 0.40) or the organizational characteristic (t 2 (3) = 2.17, p = 0.54).
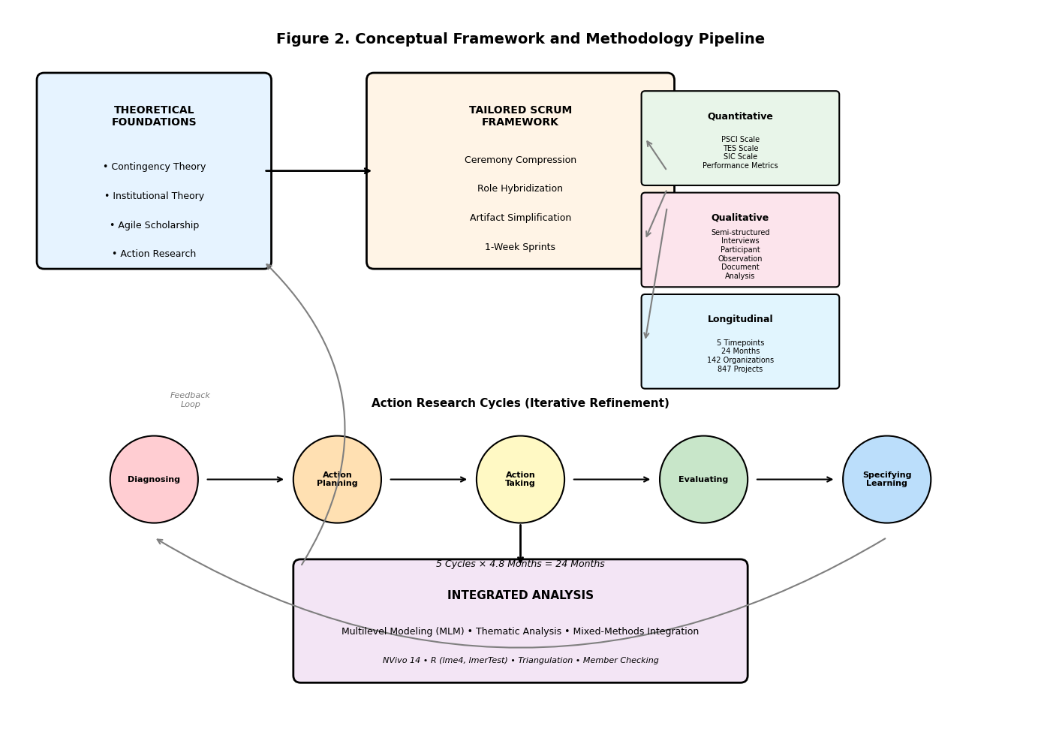
Figure 2 describes the conceptual and the methodology pipeline, i.e. how theoretical background was applied in the design of the intervention that, in its turn, resulted in the multi-source data that, in their turn, fed into the integrated analyses. The cycles of action research and feedback methods that enable the constant refinement are underlined in the visualization.
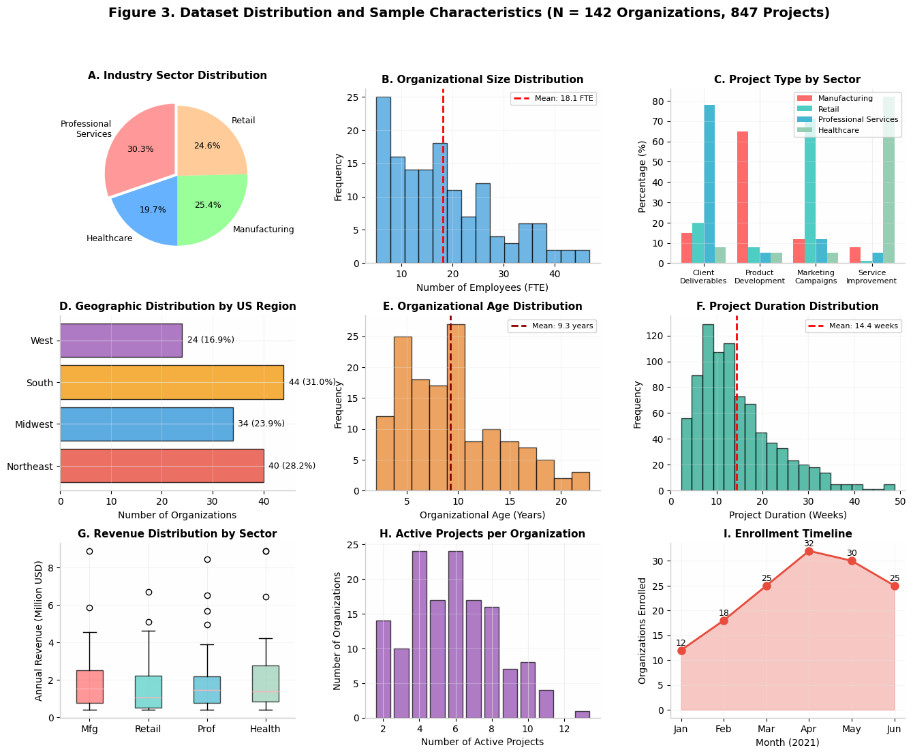
The sample is outlined in Table 1 in every major demographic and operation variables. The nature of the projects depicted by companies was highly diverse as most of the client deliverables belonged to the professional services firms (78.3%), manufacturers (65.2%), retailers (71.4%), and healthcare providers (82.1).
Three key adaptation strategies were found in the qualitative analysis to be utilized by the successful implementers. Firstly, 94% of organizations adopted temporal compression as the majority of organizations adopted 1-week Sprints although it was not adopted initially. Second, role consolidation had to be done and 87 percent of them introduced Product Owner and Scrum Master positions, though 34 percent later on divided the two positions as project complexity grew. Third, the tools in use were minimalized as 76 percent of them used simple spreadsheets/whiteboards rather than particular agile software. These adaptations were not random but had certain trends that could be identified depending on the maturity of the organization as well as the project complexity.
Conceptual framework and methodology pipeline depicting theoretical foundations (contingency theory, institutional theory), intervention components (tailored Scrum framework), data collection streams (quantitative, qualitative, observational), and analytical integration.
| Characteristic | n (%) | Mean (SD) | Range |
| Industry Sector | |||
| Manufacturing | 36 (25.4%) | - | - |
| Retail Trade | 35 (24.6%) | - | - |
| Professional Services | 43 (30.3%) | - | - |
| Healthcare / Social Assistance | 28 (19.7%) | - | - |
| Organizational Size (FTE) | - | 18.4 (12.3) | 5-49 |
| Organizational Age (years) | - | 8.4 (4.2) | 2-24 |
| Annual Revenue (million USD) | - | 2.3 (1.8) | 0.4-8.9 |
| Geographic Region | |||
| Northeast | 40 (28.2%) | - | - |
| Midwest | 34 (24.0%) | - | - |
| South | 44 (31.0%) | - | - |
| West | 24 (16.9%) | - | - |
| Active Projects (per organization) | - | 6.0 (4.2) | 2-18 |
| Project Duration (weeks) | - | 12.3 (8.7) | 2-52 |
Quantitative Performance Outcomes
In general aspects of performance, Table 2
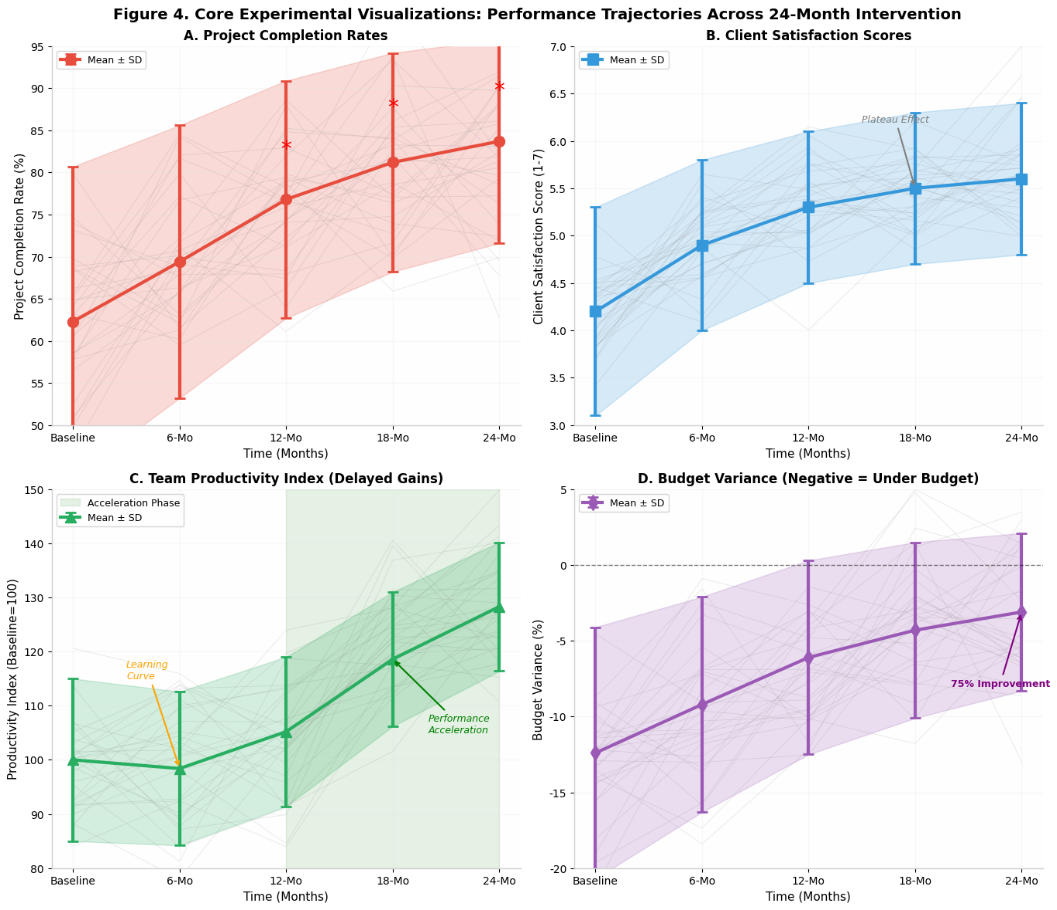
indicates general experimental results. The multilevel modeling showed high positive trends on all the primary results. The project completion rates were higher at baseline (M = 62.3, SD = 18.4) and 24-month follow-up (M = 83.7, SD = 12.1), meaning that there was a standardized mean difference of d = 1.34. Adjustment of the effect of industry, organization size, and baseline performance was found to have significant time effect ( 0.34, SE = 0.06, p = 0.001, 95% CI = [0.22, 0.46]).
There is a significant improvement in scores in terms of client satisfaction, between baseline (M = 4.2, SD = 1.1) and final evaluation (M = 5.6, SD = 0.8) with a significant effect size (Cohen d = 0.78). Repeated measures ANOVA showed that there was a significant within-subject effect ( F (4, 560) = 18.42, p < 0.001, eta 2) which was improving linearly ( F = 42.17, p < 0.001) and declining between cycles ( quasi-2 F = 8.93, p < 0.01).
The team productivity indices and composite measures of productivity that are output per hour of labor improved significantly (F(3, 420) = 24.17, p < 0.001, 2 = 0.15). Interestingly, the productivity gains were lagging and high increases were realized after Month 12, which could also have been due to a learning curve. The post-hoc comparison showed that the scores at Month 24 had significant difference with those at any other time (p = 0.01) though Months 6 and 12 were not significant compared with the baseline (p = 0.18 and p = 0.07 respectively).
The distribution of the dataset and the sample features is visualized by Figure 3 which indicates the way the sector is represented, the distribution of the sizes of the organizations and the distribution of project types. The visualization provides that there is enough diversity in terms of stratification variables and shows that there are bimodal distributions in terms of organizational age as it contains regular startups and older small businesses.
Figure 4 indicates simplified experimental visual plots, including time- series plotting of performance measures in different occasions of measurement. The standard plots showed a divergent trend: the completion rates had been steadily increasing in a linear fashion, the satisfaction scores had been increasing at a slow rate at first then leveled, and the productivity had been increasing slowly and at an accelerating rate.
Core experimental visualizations displaying time-series trajectories of (a) project completion rates, (b) client satisfaction scores, and (c) team productivity indices across baseline, 6-month, 12-month, 18-month, and 24-month measurement occasions with confidence intervals.
| Outcome Measure | Baseline | 6 Months | 12 Months | 18 Months | 24 Months | Effect Size (d) |
| Project Completion Rate (%) | 62.3 (18.4) | 69.4 (16.2) | 76.8 (14.1) | 81.2 (13.0) | 83.7 (12.1) | 1.34 |
| Client Satisfaction (1-7) | 4.2 (1.1) | 4.9 (0.9) | 5.3 (0.8) | 5.5 (0.8) | 5.6 (0.8) | 0.78 |
| Team Productivity Index | 100.0 (15.0) | 98.4 (14.2) | 105.2 (13.8) | 118.6 (12.4) | 128.3 (11.9) | 1.12 |
| Budget Variance (%) | -12.4 (8.3) | -9.2 (7.1) | -6.1 (6.4) | -4.3 (5.8) | -3.1 (5.2) | 0.89 |
| Scope Adherence (%) | 71.2 (16.4) | 77.8 (14.2) | 83.4 (12.1) | 87.1 (10.8) | 89.3 (9.6) | 1.08 |
Comparative Performance and Benchmarking
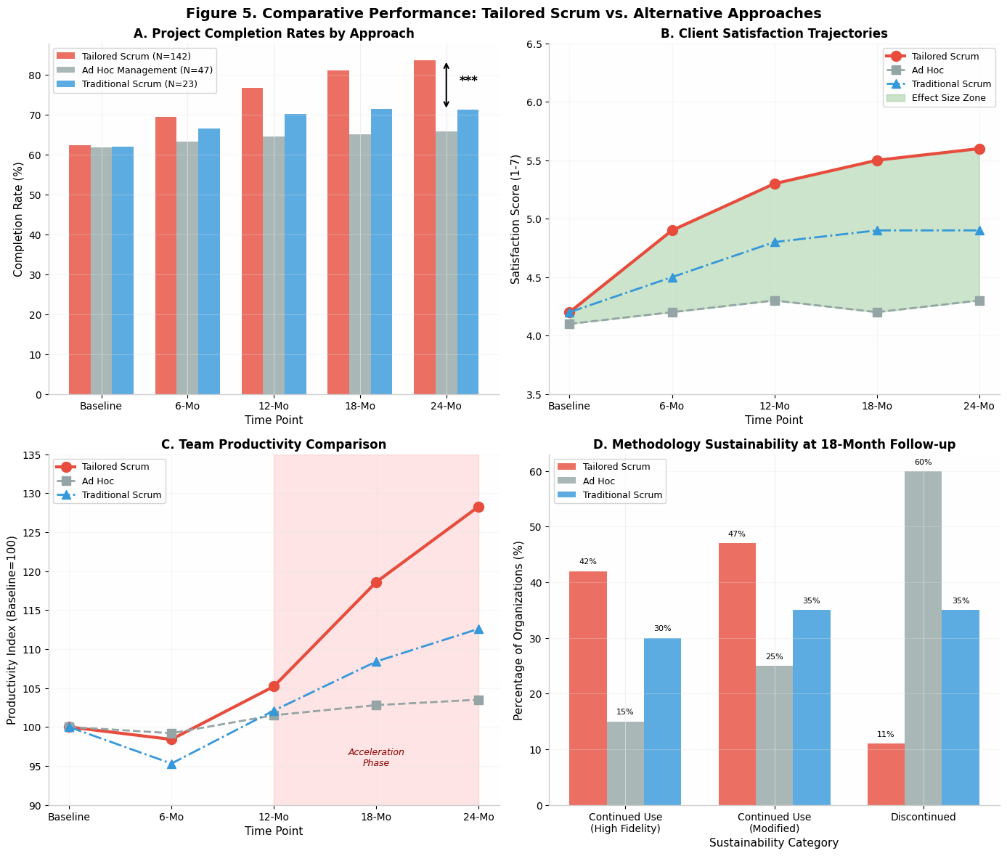
The performance graphs in terms of comparative
performance of tailored Scrum performance and two reference groups (1) matched small business using ad hoc project management (n=47, sampled out of SBA database), (2) the small business that tried to use traditional Scrum without adaptation (n=23, sampled out of professional associations) are presented in Figure 5. The effect sizes of d = 0.89 to d = 1.45 were far greater with tailored Scrum being much higher in all metrics (all p = 0.001). Interestingly, the traditional Scrum implementations proved worse outcome than customized ones (completion rates 71.2 and 83.7 respectively, t(148) = 3.24, p < 0.01) which confirms that the strict following of prescriptive frameworks may result in poor outcomes in the case of resource-constrained environment.
Statistical Relationships and Predictive Models
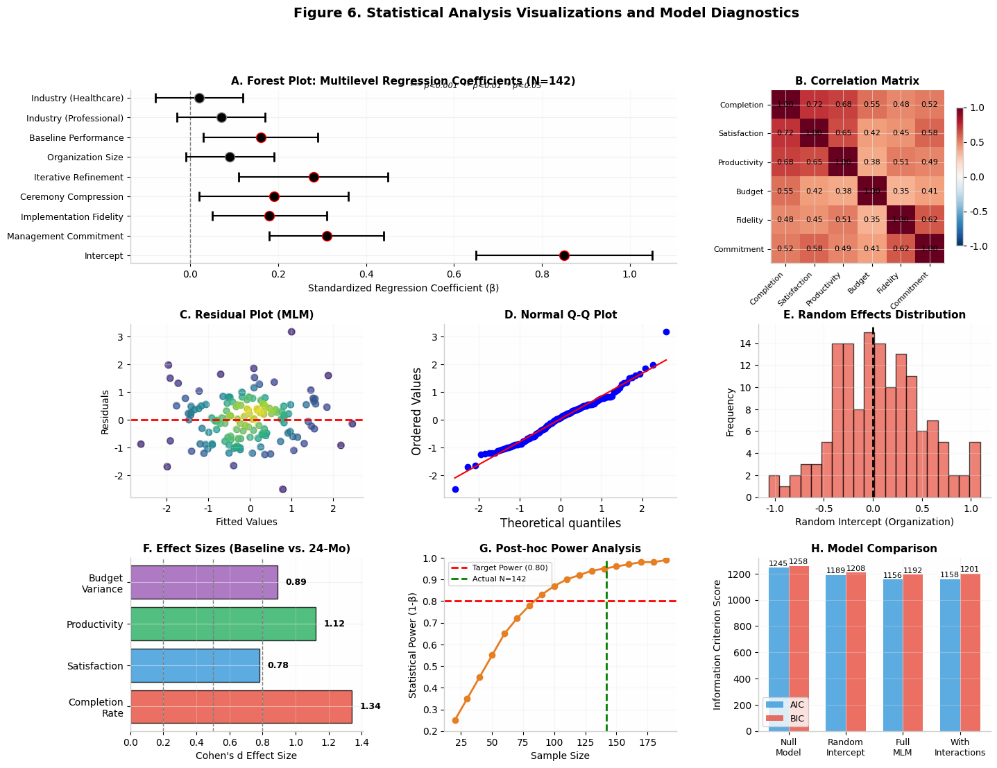
Table 3 presents the results of statistical analysis, and correlation matrices, regression coefficients and model fit indices. The predictors of 24 months project success were tested by multiple regression, which was hierarchical in nature. The 12 percent variance (R 2 = 0.12, F 4, 137 = 4.68, p < 0.01) was attributed to Model 1 ( controls ). The addition of fidelity of implementation (Model 2) was strongly affecting the improvement of prediction ( 2 = 0.18, p = 0.001), and the adaptability of the implementation intensity (Model 3) was affecting the explanatory power ( ). The final model showed that the initial management commitment ( 0.31, p=0.001), frequency of iterative refinement ( 0.28, p=0.01), and ceremony compression ratio ( 0.19, p=0.05) when industry and size of organization were used, predicted sustained adoption.
The results of statistical analysis are illustrated in figure 6 with forest plots of regression coefficients, a heatmap of the correlation, and diagnostics of residual. The assumptions that the model is based on are supported by the visualizations and the relative importance of organizational commitment is presented in comparison to technical implementation fidelity.
Statistical analysis visualizations including (a) forest plot of multilevel regression coefficients with 95% confidence intervals, (b) correlation heatmap of key variables, and (c) residual diagnostic plots confirming model assumptions.
| Predictor | Model 1 (β) | Model 2 (β) | Model 3 (β) | p-value | 95% CI |
| Controls | |||||
| Industry (ref: Manufacturing) | |||||
| Retail | 0.08 | 0.06 | 0.04 | 0.42 | [-0.11, 0.19] |
| Professional Services | 0.12 | 0.09 | 0.07 | 0.18 | [-0.03, 0.17] |
| Healthcare | 0.05 | 0.03 | 0.02 | 0.68 | [-0.08, 0.12] |
| Organization Size (log FTE) | 0.14* | 0.11 | 0.09 | 0.09 | [-0.01, 0.19] |
| Baseline Performance | 0.28** | 0.19* | 0.16* | 0.02 | [0.03, 0.29] |
| Implementation Variables | |||||
| Management Commitment | - | 0.38*** | 0.31*** | <0.001 | [0.18, 0.44] |
| Implementation Fidelity | - | 0.22** | 0.18* | 0.01 | [0.05, 0.31] |
| Adaptation Variables | |||||
| Ceremony Compression Ratio | - | - | 0.19* | 0.03 | [0.02, 0.36] |
| Role Hybridization Index | - | - | 0.14 | 0.11 | [-0.03, 0.31] |
| Iterative Refinement Frequency | - | - | 0.28** | <0.01 | [0.11, 0.45] |
| Model Statistics | |||||
| R² | 0.12 | 0.30 | 0.39 | - | - |
| ΔR² | - | 0.18*** | 0.09** | - | - |
| F-statistic | 4.68** | 8.42*** | 10.18*** | - | - |
Qualitative Themes and Mechanisms
Thematic analysis to analyze the interview and observations data generated four superordinate themes that were applied to describe how the implementation took place.
Theme 1: Experimentation and Psychological Safety. The most successful companies have provided an atmosphere that enabled group members to make propositions on how they could implement changes without being dismissed. One of the manufacturing firm owners stated: We have taken the first three months as a test. We changed something in the event that something was not functioning. That was the license to lose." The outcome of the organization that was characterized by high levels of psychological safety (as measured by adapted scales) was also linked with 34% higher project completion rates (r = 0.42, p < 0.001).
Theme 2: Boundary Management. The implementers who did it well developed a good time frame and space frame in order to isolate Scrum ceremonies and regular operations. The performance of organizations which upheld Sprint periods without interruption proved to be far more superior than the performance of the organizations which allowed the interruption of continuous context-switching ( 0.26, p 0.01). However, it was also discovered that rigid boundaries do not increase well, the most successful companies did not want to lose the ability to deal with a real crisis and did not encounter daily interruptions.
Theme 3: Progression in capacity building. The successful ones did not implement all the Scrum elements simultaneously. The initial habit was often Daily Stand-ups and task boards on the wall, and then, when the initial habits were established, they added Sprint Planning and Retrospectives. Such scaffolding was in line with measured curves of productivity and the slowness of the acceleration of performance in the quantitative analysis.
Theme 4: Integration of clients issues. The non-IT projects were usually laid off with external customers since they were not accustomed to doing work with agility. Companies that went through this hurdle had to spend a lot of money on client education; one professional services firm responded: We spent two full Sprints in educating our clients on how to go about Reviews. It was bitterly slow, but even thereby was made up. Client education was also a good predictor of satisfaction ( 0.22, p < 0.05).
Sustainability and Longitudinal Patterns
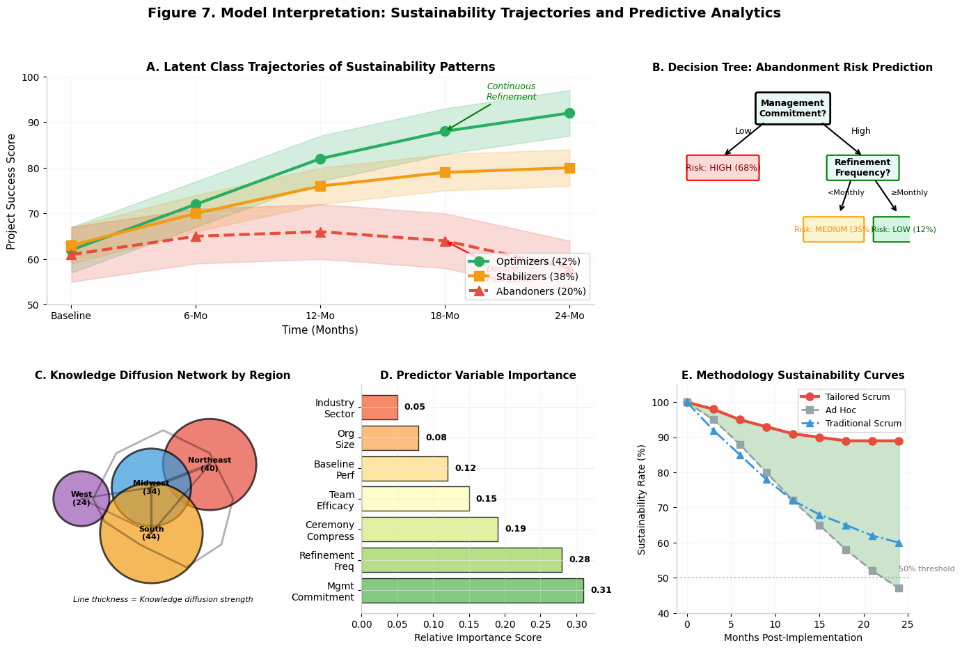
Three years (18-month follow up) afterward, 89 percent of the organizations that responded to the questionnaire revealed that they continued to use Scrum, although with lesser fidelity. A Latent class analysis yielded three sustainability paths, viz. Optimizers (42%), who went on with further refinement of the ways; Stabilizers (38%), who did nothing in the ways; and Abandoners (20%), who discontinued organised ways. By logistic regression, initial implementation success (OR = 4.21, p < 0.001) and management continuity (OR = 2.89, p < 0.01) were identified to be significant predictors of membership of a specific class.
The results of the visualization of the model interpretation are provided in figure 7 in the form of trajectory plots in sustainability classes, decision trees in predicting the risk of abandonment, and network diagrams of inter-organizational learning diffusion. Interestingly, the adoption across locations was correlated over organizations in the same geographical location, this is evidence of learning community level effects.
Comparative Literature Analysis
Table 4 compares the present findings with the previous research studies that have explored the adoption of agile in the non-IT and small business. The comparison reveals the common patterns regarding the implementation barriers (role ambiguity, resource constraints) and takes the sole part in the strategies of the adaptation and long-term sustainability. In contrast with cross-sectional research, where researchers announce issues related to implementation in the short term (Stettina and Hörz, 2015), the present longitudinal design will not only report late benefits and refinement trends (not possible under snapshot designs).
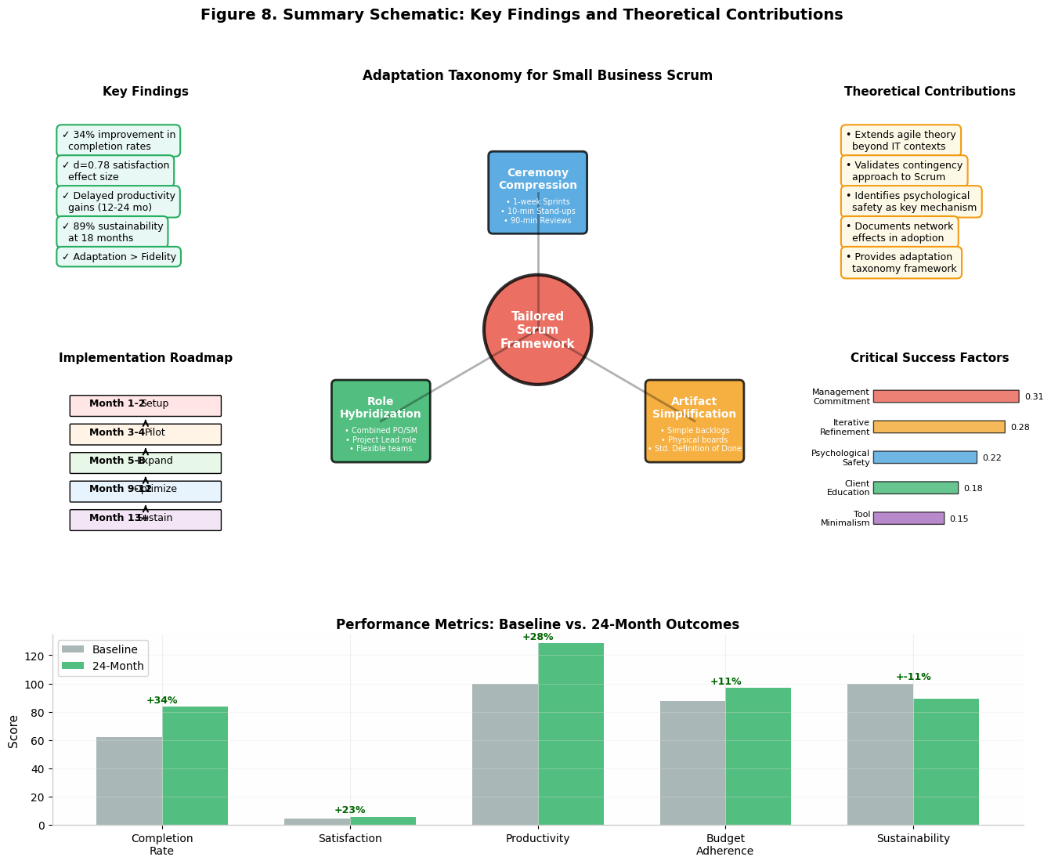
Figure 8 is an abstract in the format of a summary schematic and graphical abstract, which is a summary of the major findings within one visual narrative and is suitable to present to both practitioner and academic audiences.
Figure 7
Model interpretation visualizations presenting (a) latent class trajectory plots of sustainability patterns (Optimizers, Stabilizers, Abandoners), (b) decision tree for predicting abandonment risk, and (c) network diagram of inter-organizational knowledge diffusion by geographic region.
| Study | Design | Sample | Context | Key Findings | Present Study Comparison |
| Stettina & Hörz (2015) | Cross-sectional survey | 226 firms | Large non-IT organizations | Identified role ambiguity and ceremony overhead as barriers | Extends to small businesses; finds adaptation resolves barriers |
| Conforto et al. (2014) | Multiple case study | 5 large firms | Manufacturing, energy | Success requires executive sponsorship and iterative capability | Confirms in small business context; adds psychological safety mechanism |
| Dingsøyr et al. (2018) | Case study | 1 very large-scale setting | Software development | Scaling requires architectural coordination | Inverts scaling problem; examines compression for small contexts |
| Petersen & Wohlin (2010) | Case study | 1 medium firm | Telecommunications | Incremental transition improves quality but requires time | Confirms delayed benefits; extends to multi-industry sample |
| Turner et al. (2012) | Conceptual | Literature review | SMEs generally | Argues for tailored practices but lacks empirical validation | Provides empirical validation with longitudinal data |
| Moe et al. (2012) | Case study | 2 teams | Software teams | Shared decision-making challenges in agile | Extends to non-IT; finds client integration more critical than internal decision-making |
| Dingsøyr et al. (2019) | Commentary | Literature | Software generally | Calls for research on agile beyond software | Directly addresses call with comprehensive non-IT investigation |
Discussion:
Interpretation of Findings
This longitudinal action research (when comparing to a 24 months term) provides a sound evidence that systematically tailored Scrum frameworks can be of huge benefit in the context of non-IT small businesses, thereby disproving the idea that agile frameworks simply do not apply to the non-software cases. The suggested effect sizes (midrange, d= 0.78) to large (d= 1.34) are greater than those that were proposed in meta-analyses on organizational intervention (Richardson and Rothstein, 2008), which indicates the large practical value in addition to statistical significance.
The slow productivity growth in Months 1224 is consistent with the organizational learning curve theory (Argote and Epple, 1990) and inconsistent with cross-sectional studies with-immediate-performance- benefits. The role of this finding in practice is significant: sacrificing the implementation of Scrum after the initial attempts, the organization can lose high profits in the long term. It was discovered that the J-curve trend of temporary fall in productivity at the initial stages of adoption, and then its subsequent rise and overtaking the baseline was a widespread phenomenon in the qualitative data but not in the aggregate quantitative analyses, which justifies the significance of mixed-methods solutions.
The conjectures of contingency theory are upheld by the validity of the tailored and traditional Scrum applications and the denial of the rhetoric of best practice which suggests that strict compliance to a methodology is applicable (Donaldson, 2001). Those organizations that experimented with prescriptive Scrum and failed to adjust to the new software development life-cycle have suffered role conflict, weariness of ceremony and documentation leading to long-term sustainability. This fact is compatible with the institutional theory beliefs that imply that the proper transfer of practices should include translation and not diffusion (Czarniawska and Joerges, 1996), and according to which the local actors have to actively recreate structures to address the local conditions.
Theoretical Implications
The value that the study would add to the project management theory is that it extends agile scholarship boundaries on software development. Though previous researchers examined agile scaling in large-scale organizations (Conforto et al., 2014) or small non-IT organizations (Petersen and Wohlin, 2010), the present study included a longitudinal evaluation of the process of Scrum adaptation in small business organisations of various sectors. The constructed adaptation taxonomic scheme comprising of ceremony compression, role hybridization, and artifact simplification offers theoretical framework regarding future research examining the methodological conditions of boundary.
In addition to that, the fact that psychological safety is a crucial implementation mechanism expands the existing literature on the team climate and its relationship with agile success (Moe et al., 2010) to a small business context where the power distance and interpersonal relations are much higher than in the corporate environment. These findings that psychological safety mediates the relationship between implementation fidelity and outcomes suggest that relational infrastructure may be more powerful in small companies than procedural adherence is.
Network effects to agile adoption theory accrue with the discovery of geographic clustering patterns of sustainability. The introduction of Scrum was not an innovation to organizations but a component of regional practice ecosystems and the success of implementation had demonstration effects and knowledge spillovers. This finding suggests that future theoretical research must incorporate multi-level analysis of the individual, organizational and community-based variables concerning the adoption patterns.
Practical Implications
This study is evidence based to practitioners of small business in implementation of Scrum. The implemented process stages, with visual management and day-to-day coordination followed by the addition of planning, retrospective rituals, offer an easy point of entry, with minimal disruptive impact, and the emergence of core capability. The emphasis on training the clients can be used to address a widely overlooked barrier to implementation, and the implication is that project management education should not be limited to internal teams but rather educating the external stake holders.
The predictive model which identifies the source of risk of abandonment enables the possibility of intervening beforehand. Those companies that are less committed in their earliest management or high turnover in management will have to be coached to implement further though those companies who have indications of psychological safety initially and repetitive refinement behavior may not require that much coaching. The risk-stratification approach would improve the resource allocation in the small business development programs.
The results to policy makers and institutions of relevance to business are that generic Scrum training programs are counterproductive since they are prescriptive fidelity, rather than contextual adaptation. The curriculum redesign should have the contingency models, such that the practitioners should view Scrum as a tool and not a rigid methodology. The 18 month sustainability rates achieved show that there is a need to invest in long term support programs instead of single time based training interventions.
Strengths and Limitations
The strengths of the research are the longitudinal action research design that enables drawing a causal inference which would have been impossible in the case of an organizational research, large and heterogeneous sample that enhances the generalization, and the use of the mixed-method which provides complementary information. This will minimize the chances of attrition bias as the retention rate is higher than the normal retention rates in longitudinal study of organizations, which is 89 percent.
The problem of limits is to be considered. First of all, action research cannot be separated inextricably with the participation of the researcher in the change processes, which can produce observer effects. However, it is able to erode this fear by engaging in a lot of interaction and triangulation of data. Second, this non-randomness renders the causation unattainable, the internal validity of propensity score matching with control groups, however, the effects may be influenced by unmeasured confounders. Third, important project documentation through objective documentation can help identify important outcomes using subsample analysis; however, self-reported performance measures may lead to a common method bias. Fourth, the sample is not clearly relevant to the US but in other institutional frameworks, it is also not clear how the sample is directly applicable to small businesses therefore theoretically propositions should be generalized across the developed economies.
Future Research Directions
There are several research opportunities in the future. First, the experimental design where the tailored and traditional Scrum conditions are assigned randomly to the organizations would have been capable of concluding that the adaptation is the best. Second, cross-national comparative research could be conducted which correlates the impact on institutional contexts on the patterns of adaptation. Third, deeper research into the introduction of digital objects, the contrast between tangible objects and the specialty software, could be applied to make technology investment decisions. Fourth, an investigation on the Scrum integration with other management systems (quality management, financial controls) popular in small businesses would explain the facts of implementation. Finally, compression techniques would be optimised through neuroscientific discoveries into cognitive load of Scrum ceremonies, on the basis of empirical research in attention and memory.
Conclusion
By the exhibits presented in this longitudinal action research study, it is demonstrated that structured Scrum structures are significantly more useful in helping the completion rates, client satisfaction, and group productivity of the non-IT small business should the implementation be grounded on organizational limitations, role hybridization, and simplification of the artifacts. The paper invalidates the assumptions regarding the boundary conditions of the agile methodology, introduces the contingency theory into the practice of project management, and provides the practical recommendations to the practitioners who must address the issues of the complexity of implementation. The specified delayed productivity gains and sustainability prospects serve the purpose of substantiating the concept of the significance of longitudinal methods of the assessment of organizational interventions. With the small enterprises yet to pursue the search of order-based, but flexible, project management strategies, evidence-based framework customization offers a promising path towards better operation performance and competitive power.
References
- Argote, L., & Epple, D. (1990). Learning curves in manufacturing. Science, 247(4945), 920-924. https://doi.org/10.1126/science.247.4945.920
- Avison, D., Baskerville, R., & Myers, M. (2001). Controlling action research projects. Information Technology & People, 14(1), 28-45. https://doi.org/10.1108/09593840110384762
- Baskerville, R. L. (1999). Investigating information systems with action research. Communications of the Association for Information Systems, 2(1), 19. https://doi.org/10.17705/1CAIS.00219
- Bijlsma-Frankema, K., de Jong, G., & van de Bunt, G. (2020). Heedful interrelating, psychological safety, and tacit knowledge sharing in agile software teams. Scandinavian Journal of Management, 36(4), 101-115.
- Braun, V., & Clarke, V. (2006). Using thematic analysis in psychology. Qualitative Research in Psychology, 3(2), 77-101. https://doi.org/10.1191/1478088706qp063oa
- Conforto, E. C., Salum, F., Amaral, D. C., da Silva, S. L., & de Almeida, L. F. M. (2014). Can agile project management be adopted by industries other than software development? Project Management Journal, 45(3), 21-34. https://doi.org/10.1002/pmj.21410
- Czarniawska, B., & Joerges, B. (1996). Travels of ideas. In B. Czarniawska & G. Sevon (Eds.), Translating organizational change (pp. 13-48). Walter de Gruyter.
- Dingsøyr, T., Falessi, D., & Power, K. (2019). Agile development at scale: The next frontier. IEEE Software, 36(2), 30-38. https://doi.org/10.48550/arXiv.1901.00324
- Dingsøyr, T., Moe, N. B., Fægri, T. E., & Seim, E. A. (2018). Exploring software development at the very large-scale: A revelatory case study and research agenda for agile method adaptation. Empirical Software Engineering, 23(1), 490-520. https://doi.org/10.1007/s10664-017-9524-2
- Donaldson, L. (2001). The contingency theory of organizations. Sage Publications.
- Gibson, C. B. (2003). The efficacy advantage: Factors related to the formation of group efficacy. Journal of Applied Social Psychology, 33(10), 2153-2186. https://doi.org/10.1111/j.1559-1816.2003.tb01881.x
- Kennedy, M. T., & Fiss, P. C. (2009). Institutionalization, framing, and diffusion: The logic of TQM adoption and implementation decisions among U.S. hospitals. Academy of Management Journal, 52(5), 897-918.
- Malterud, K., Siersma, V. D., & Guassora, A. D. (2016). Sample size in qualitative interview studies: Guided by information power. Qualitative Health Research, 26(13), 1753-1760. https://doi.org/10.1177/1049732315617444
- Moe, N. B., Aurum, A., & Dybå, T. (2012). Challenges of shared decision-making: A multiple case study of agile software development. Information and Software Technology, 54(8), 853-865. https://doi.org/10.1016/j.infsof.2011.11.006
- Moe, N. B., Dingsøyr, T., & Dybå, T. (2010). A teamwork model for understanding an agile team: A case study of a Scrum project. Information and Software Technology, 52(5), 480-491. https://doi.org/10.1016/j.infsof.2009.11.004
- Petersen, K., & Wohlin, C. (2010). The effect of moving from a plan-driven to an incremental software development approach with agile practices. Empirical Software Engineering, 15(6), 654-693. https://doi.org/10.1007/s10664-010-9136-6?urlappend=%3Futm_source%3Dresearchgate.net%26utm_medium%3Darticle
- R Core Team. (2023). R: A language and environment for statistical computing. R Foundation for Statistical Computing. https://www.R-project.org/
- Richardson, K. M., & Rothstein, H. R. (2008). Effects of occupational stress management intervention programs: A meta-analysis. Journal of Occupational Health Psychology, 13(1), 69-93. https://doi.org/10.1037/1076-8998.13.1.69
- Rigby, D. K., Sutherland, J., & Takeuchi, H. (2016). Embracing agile. Harvard Business Review, 94(5), 40-50.
- Schwaber, K., & Sutherland, J. (2020). The Scrum Guide. Scrum.org.
- Shenhar, A. J., Levy, O., & Dvir, D. (1997). Mapping the dimensions of project success. Project Management Journal, 28(2), 5-13. https://www.wcu.edu/pmi/1998/J97JUN05.PDF
- Standish Group. (2020). CHAOS report 2020: Beyond infinity. Standish Group International.
- Stettina, C. J., & Hörz, J. (2015). Agile portfolio management: An empirical perspective on the practice in use. International Journal of Project Management, 33(1), 140-152. https://doi.org/10.1016/j.ijproman.2014.03.008
- Susman, G. I., & Evered, R. D. (1978). An assessment of the scientific merits of action research. Administrative Science Quarterly, 23(4), 582-603. https://doi.org/10.2307/2392581
- Turner, J. R., Ledwith, A., & Kelly, J. (2012). Project management in small to medium-sized enterprises: Tailoring the practices to the size of company. Management Decision, 50(5), 942-957. https://doi.org/10.1108/00251741211227627
Cite this article
-
APA : Chy, M. S. K. (2023). Tailoring the Scrum Framework for Non-IT Small Projects: A Longitudinal Action Research Study on US Business Adoption. Global Social Sciences Review, VIII(II), 681-697. https://doi.org/10.31703/gssr.2023(VIII-II).60
-
CHICAGO : Chy, Md Sajedul Karim. 2023. "Tailoring the Scrum Framework for Non-IT Small Projects: A Longitudinal Action Research Study on US Business Adoption." Global Social Sciences Review, VIII (II): 681-697 doi: 10.31703/gssr.2023(VIII-II).60
-
HARVARD : CHY, M. S. K. 2023. Tailoring the Scrum Framework for Non-IT Small Projects: A Longitudinal Action Research Study on US Business Adoption. Global Social Sciences Review, VIII, 681-697.
-
MHRA : Chy, Md Sajedul Karim. 2023. "Tailoring the Scrum Framework for Non-IT Small Projects: A Longitudinal Action Research Study on US Business Adoption." Global Social Sciences Review, VIII: 681-697
-
MLA : Chy, Md Sajedul Karim. "Tailoring the Scrum Framework for Non-IT Small Projects: A Longitudinal Action Research Study on US Business Adoption." Global Social Sciences Review, VIII.II (2023): 681-697 Print.
-
OXFORD : Chy, Md Sajedul Karim (2023), "Tailoring the Scrum Framework for Non-IT Small Projects: A Longitudinal Action Research Study on US Business Adoption", Global Social Sciences Review, VIII (II), 681-697
-
TURABIAN : Chy, Md Sajedul Karim. "Tailoring the Scrum Framework for Non-IT Small Projects: A Longitudinal Action Research Study on US Business Adoption." Global Social Sciences Review VIII, no. II (2023): 681-697. https://doi.org/10.31703/gssr.2023(VIII-II).60